The five criteria I chose to judge the different species were:
-Reduces/threatens native species in invaded area
-Interference with agriculture
-Spreads/transmits diseases
-Threatens the invaded habitat
-Rate of reproduction
These characteristics are ones that many invasive species possess and use to affect the environment and people in their native and invaded areas. Using these characteristics, I can measure the degree of harmfulness of each species. As I read through the profiles of several invasive species I noticed that these characteristics appeared in many of them and impacted the environment greatly, therefore, I chose these five characteristics to be my criteria.
I first went to www.issg.org and noticed that there was a section containing 100 of the worst invasive species. Using this list I gathered not all, but several of the invasive species that affected South America and that I used to determine the worst. As I looked at the profile of each species, I payed more attention to the section "Impact Info," which showed me how the species impacted different parts of the environment and society and in some cases precisely where the environment was affected and how it was affected in that area. This section helped me compare the five species I found.
As I analyzed the data I collected, it was easy to eliminate the Aedes aegypti, Cervus elaphus, and Herpestes auropunctatus. Why was it so easy for me to eliminate these species? These species did not affect each characteristic as negatively and badly as the final two species did. The two final species that I will be bringing to class are the Cyrprinus carpio and the Bemisia tabaci. As I read through many sources about the impacts on the environment of these species, I notices that these species greatly affected all the characteristics that I chose easily. These two species most negatively affected those characteristics as well. These species destructed the environment in many ways, carried diseases, interfered with agriculture, harmed the native species of the invaded area, and reduced/slowed the rate of reproduction. In the end, I decided to enter Cyrprinus carpio in the competition. Cyrprinus carpio is also known as common carp.
Montag, 26. September 2011
Montag, 5. September 2011
Is the Indian Embassy Field Biologically Diverse?
I believe that the Indian Embassy Field is biologically diverse based on three pieces of data we acquire last class. First, the Simpson's Diversity Index for the field we collected our plants from was 0.095. Knowing what I learned last class, 0 means infinite diversity and 1 means no diversity. Since 0.095 is very close to zero, this shows that the field is very diverse. Second, the Simpson's Index of Diversity for the field .905 This time, it is a bit different. 0 means no diversity and 1 means infinite diversity. Like the data showed before, .905 is very close to 1, the number representing infinite diversity. Lastly, the Simpson's Reciprocal Index of Diversity is 10.515. In this case, 1 represents no diversity. The maximum number in this case is 56, the total number of species. Even though 10.515 is not that close to 56, there is still some diversity. Based on the size of the field, 56 species is quite a lot. I'm sure if our class was to go out and collect plants again, we might be able to find 56 more species. In conclusion, based not the data we collected the Indian Embassy Field is biologically diverse.
Donnerstag, 1. September 2011
Seconds Looks and Accurate Measurements!
Last Monday, August 29th, we spent most of our class outside. This time we didn’t just observe the basic characteristics of our plants, but measured many other factors such as height, crown size, and pH of the soil. While I was sitting by my plant, I observed many basic changes in it since we had last worked with it. The first measurement I took was the height of my plant, which was 86.8 centimetres. I then measured the crown of my plant, which was 76.7 centimetres. For the next measurement, I picked four leaves off my plant. I made sure these leaves were located at different places on my plant. I first measured the sunlight at I got 74743. The first leaf I picked was on the top-right of my plant, therefore, most likely receiving more sun. The amount of sunlight that leaf absorbed was 4062. This leaf was very dark compared to the others. I then measured the sunlight again and got 74812. I found the second leaf on the top-left section of my plant. The amount of sunlight this leaf had absorbed was 3162. This leaf was mainly green. Once again, I measured the sunlight and got 74382. The third leaf was located in the inside of my plant on the right. The amount of sunlight this leaf had absorbed was 1777. This plant was light green with hints of brown. The fourth and last leaf was located on the bottom of my plant towards the middle. This time when I measured to sunlight, I got 65990 and the amount of sunlight this leaf had absorbed was 665. This leaf was completely dark green. As you see, the measurement for the sunlight decreased as the day progressed and the farther down the leaf was, the lower the amount of sunlight absorbed was. I then measured the pH of the soil and got 6.82 meaning it is acidic. This showed that the soil surrounding my plant had high concentrations of Copper, Zinc, Sulphur, Manganese, Potassium, Phosphorous, and Nitrogen. It was also on the borderline of Calcium and Magnesium. The sizes of the branches/trunks of my plant varied. There were some very nutrient-rich, thick branches/trunks and there were some thinner ones as well. The first branch/trunk I measured had a diameter of 1.204 centimetres. This was the thinnest branch/trunk of my plant. The second branch/trunk had a diameter of 2.23 centimetres. This was the thickest branch/trunk of my plant. The diameter of the third branch/trunk I measured was 1.31 centimetres and lastly, the diameter of the fourth branch/trunk was 1.66 centimetres. These measurements would leave me with an average of 1.6 centimetres.
There were also some basic observations I found quite interesting. Lots of the flowers had fallen of my plant. This could be a result of the lack of rain or the lack of pollination. I also observed that the branches/trunks of my plant had gotten a lot thicker. This shows that the branches/trunks had gained more nutrients and water, but like I said in my last sentence, there is obviously a lack of rain in Brasilia this time of year. This would lead me to the conclusion that my plant is being watered quite regularly.
The real question is, what is the importance of measuring our plants? As I remember the first few days of school, I remember receiving this assignment. I remember on of the main goals of this assignments being to observe the changes in our plants throughout the year. If we do not measure our plants consistently, we will not know the change that has occurred. These measurements will also help us assess what our plant needs, just like a doctor or nurse examines us and then prescribes us with antibiotics. We would be “prescribing” our plants with water or nutrients.
*I do have recent pictured of my plant, but blogger would not let me upload them. I'l try again tomorrow and upload the pictures as soon as I can.
Breeding Bunnies: DIscussion Questions
1. What was your original hypothesis?
My original hypothesis was, "If the trait is needed to survive, in this case sparse fur, then over generations, the desirable trait will become more common and the non desirable traits will die out."
2. Based on your lab data, do you need to change your hypothesis? Explain.
No, I did not need to change my hypothesis, because my data showed that the rabbits with thick and normal fur died over generations, while the rabbits with sparse fur survived.
3. Compare the number of alleles for the dominant characteristics with the number of alleles for the recessive characteristics.
At first, the benumbed of dominant alleles and recessive alleles was equal, but as generations passed, the number of recessive alleles decreased. After the first generation, there was always for dominant alleles.
4. Compare the frequencies of dominant alleles to the frequencies of the recessive alleles.
At first, the frequency of the dominant alleles to the frequency of the recessive alleles was equal. But by the second generation, the frequency of the dominant alleles was always quite a bit higher.
5. In a real rabbit habitat new animals often come into the habitat (immigrate), and others leave the area (emigrate). How might emigration and immigration affect the gene frequency of F and f in this population of rabbits? How might you simulate this effect if you were to repeat this activity?
If a new species of rabbits with different fur comes in, the rate of getting more and more sparse -haired rabbits may slow down. This other species may become dominant over the sparse haired rabbits as well. i would have to introduces another type of rabbit, meaning in order to simulate this, I would have to introduce another bean (perhaps yellow). If enough sparse-haired rabbits leave the ares, then another type of rabbit may dominate the area. If a completely different species of animal comes into the ares, they could possibly be predators and then the rabbit population might die out.
6.How do your results compare with the clss data? If significantly different, why are they different?
My results were quite alike to the class because even though their dominant characteristic might have been different, the recessive characteristic eventually died out while the dominant characteristic survived.
How are the results of this simulation an example of evolution?
One factor needed to evolve is variation. The variation in this case is the type of fur. Depending on th type of fur the rabbit has, it will or will not survive. The main factor that drove evolution in this case was fur type.
Mittwoch, 24. August 2011
Brazil's Future Population: What Will Happen Next?
1) Brazil's current age structure shows many possibilities for Brazil, in both long and short terms. In the short term (15-20 years), I think Brazil's population will continue to grow. Currently, 26.2% of Brazil's population is 0-14 years old and 67% of Brazil's population is 15-64 years old. As you can see, most of Brazil's population consists of teenagers and adults. These young adults and adults will most likely have children within the next 15-20 years. Thus, significantly increasing the population and increasing the amount of 0-14 year olds. At the same time, the older adults will become over 65 years of age and therefore, the groups will even out. As the overall population increases, it may be that the 0-14 generation today, who will be adults in the longer term, may not have as many children. Thereby, eventually leading to an overall aging of the population.
2) The increase in population in the short term may have mainly positive outcomes, where as in the long term, it may have negative ones as well. More people leads to a larger workforce which leads to increased productivity. However, eventually as Brazil becomes more developed, the continual increase in jobs and new industries may flatten leading to fewer jobs for a large population and unemployment. In the short term, everything may be good as the growth engine continues in Brazil, but as Brazil gets fully developed, that engine may slow down which could lead to a large population with fewer jobs and ultimately unemployment. A larger population needs more space. This may lead to overcrowding in major cities and a higher cost of living. With a higher cost of living, not everyone will be able to live in the expensive major cities. One possibility for them, would be to move out to the countryside of Brazil. In order to build towns and even houses, you have to clear the land which may have a negative effect on the environment if the towns are not built in a sustainable manner. At the same time, more people need more food so, the increase farming land may also be at the expense of the environment. Therefore, as the country grows and prospers, the people have to ensure that this growth is down in a sustainable manner where the growing population need are balances with overall environmental protection and conservation. A bigger population would also use more natural resources and would also need more energy so, the danger is that they would abuse the natural resources and have to determine the best energy sources which may or may not be clean energy sources. So as the population grows, they have to plan carefully to meet especially the increase energy demands in a clean way, not using more fossil fuels, but rather developing alternative sources of energy such as, hydro, wind, or solar energy. If they do not plan carefully, the increased population would most likely lead to increased pollution which would lead to further degradation of the environment.
Source: https://www.cia.gov/library/publications/the-world-factbook/fields/2010.html
Legs, Arms, and Height: Measuring Flexibility!
On August 9th, 2011 my group conducted an experiment on the second graders of EAB. The skill my group tested was flexibility. Flexibility is the quality of bending easily without breaking. In our case, "breaking" would be bending your knees or not being able to stretch your arms further. The factors we tested were arm length, leg length, and height. At the time of the experiment, we thought that the leg length of a person would be a vital factor in their flexibility. We thought that if one's legs were longer, it would be harder, because they had a longer distance to reach. In this experiment, our data supported our hypothesis. Our data show that the some of the people with the longest leg lengths (76, 77, 78 cm) had the some of the worst flexibility scores (-4, -5, 2). There was one child that was an anomaly. This child had very long legs (82 cm) and an average to high arm length (55 cm). Their flexibility score was six, which was one of the highest. I then analyzed the arm lengths of the children and how it affected their flexibility. My data showed that some of the children with the shortest legs (69,70,71 cm), had the longest arms (60,64 cm). As I analyzed my data, it showed that the arm lengths of the children did not affect their flexibility. Having a longer arm did not give you an advantage. The children with the longest arms had some of the worst flexibility scores (-2, -4, -6). Unfortunately, my group was not able to test the flexibility of the child with the longest arm length (64 cm) so therefore, my results may be slightly inaccurate. If we had tested more students, we would have been able to come to a better understanding. I was not able to draw any conclusions about the correlation between the height and flexibility of the children. The height factor varied greatly. Some of the shortest children had the best flexibility scores (5, 6, 8), and some had the worst. Also, some of the tallest children had the worst flexibility scores (-4, -5), and some had the best (3, 6). As you can see, the factors we chose were good elements for testing flexibility. We were therefore, able to draw clear conclusions. These mixed correlations shows that the arm/leg length ratio does not affect one's flexibility rather it is the length of the leg that is the biggest determinant in this experiment. That being said, I feel that there may be other factors that affect flexibility that we have not measured in this experiment. Therefore, it may be too much to conclude that you can determine a persons flexibility solely by the length of their legs. I'd like to do more experiments testing different factors such as, length of waist, ability to rotate joints in order to more fully determine the precise factors that determine a person's flexibility.
Mittwoch, 10. August 2011
First Observations!

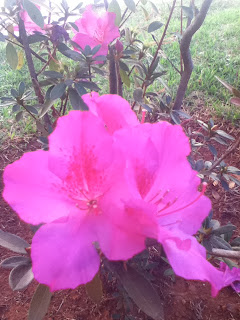
Scientific Name: Rhododendron
Location: Near main office and music/arts classrooms.
Description:
· Leaves: small, short green leaves, leaves more exposed to the sun have turned a lighter green or even yellow color
· Flower: bright pink with a long pistil and stamen, have brighter pink markings on the inside possibly used to attract insects to the flowers, pistil and stamen can be easily differentiated
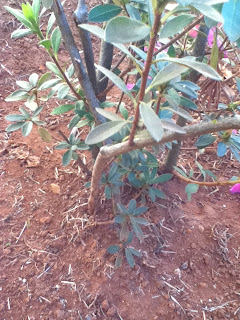
· Stem: brown (thinner and thicker at different parts), thicker parts could mean those parts have more nutrients, new stems growing
· Branches: thin brown branches, flower buds on branches, the branches with more flowers is thicker (more nutrients), and has been exposed more to the sun, new branches growing, one branch is growing (possibly has been trimmed)
· Roots: not visible
What attracted you to this particular plant on campus?
-What first stood out to me about this plant was the vibrant color of the flowers. The earth is so brown and dry right know, that the already-bright color was even more striking. I also suspected that because of its small size, it is a young plant and I will be able to observe its growth over the coming year.
What changes do you expect to see over the next 9-21 months?
-I expect this plant to get taller and grow more leaves and flowers. I also expect for the leaves to become more lush and fuller. I do not expect for the plant to grow fruit. I also do not expect for the plants roots to surface. I expect the flowers that have not yet bloomed to bloom.
After studying the plant for approximately 20 minutes, what surprises you or what aspect did you not notice before?
-I noticed that the majority of flowers were on one side of the plant and not as many on the other. I then looked at the stem/branches of the side with more flowers and noticed that they were thicker, meaning that they have more nutrients than the other stems/branches. This could be because one side is more exposed to the sun. I noticed that some leaves had a lighter green or even yellow color, which could also be connected to the sun. I then took a closer look at the flowers and could clearly see the pistil and stamen. I also saw the brighter/darker pink markings on the inside of each flower. I suspected that these markings could be used to attract insects to the flowers.


Abonnieren
Posts (Atom)